
Read this article in Français Deutsch Italiano Português Español
U.S. underground natural gas storage capacity rises in 2024

June 13, 2025
EIA data shows increases in demonstrated peak and design capacities across key regions
The U.S. Energy Information Administration (EIA) reported an overall increase in underground working natural gas storage capacity across the Lower 48 states in 2024, reflecting both enhanced utilization of existing infrastructure and selective facility expansions. The rise in storage capacity bolsters the nation’s ability to balance energy supply and demand, particularly during periods of high consumption such as the winter heating season.
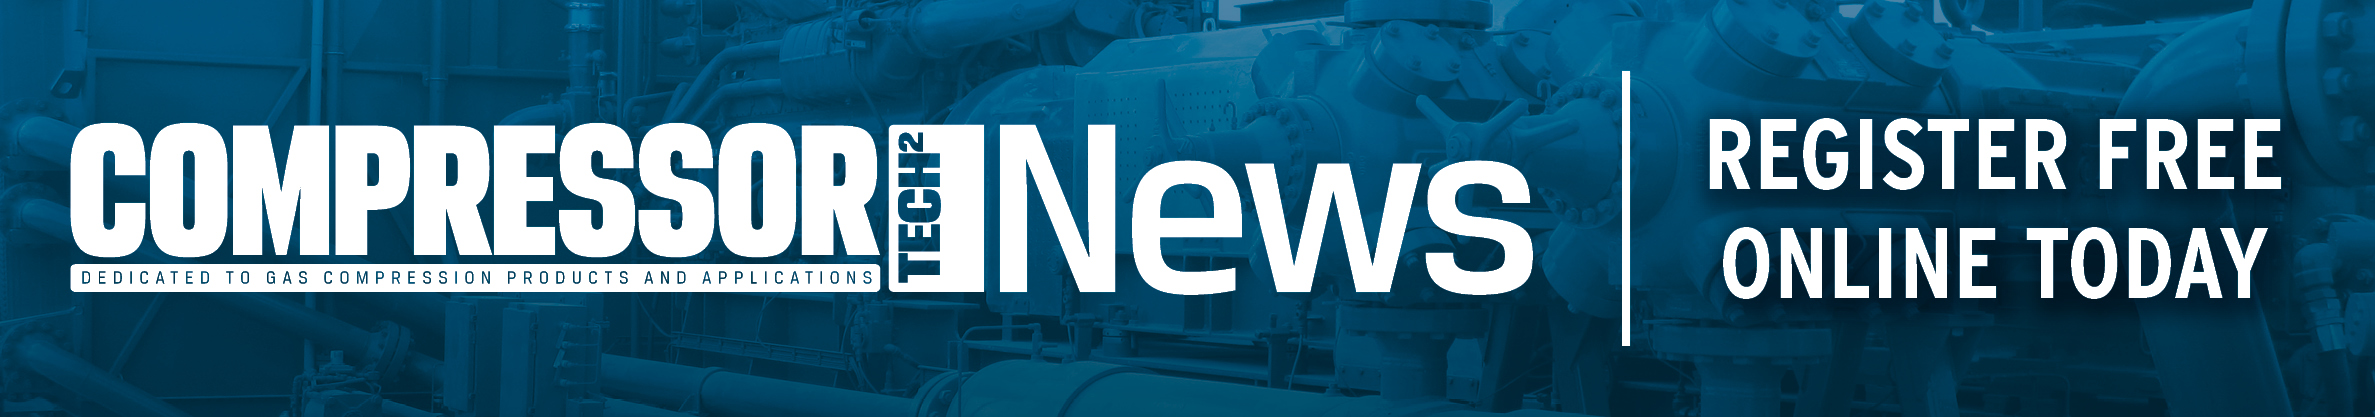
According to the EIA’s latest data, the demonstrated peak capacity—which reflects the highest volume of gas stored at each facility over the previous five years—increased by 70 billion cubic feet (Bcf), or 1.7%, reaching a total of 4,277 Bcf in 2024. Meanwhile, working gas design capacity, a measure based on the physical characteristics and regulatory parameters of storage fields, rose slightly by 3 Bcf, or 0.1%, over the same period.
Utilization and regulation drive capacity growth
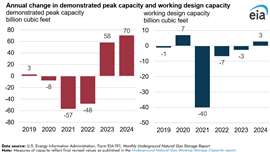
Demonstrated peak capacity rose in four of the five EIA-designated storage regions, underscoring a nationwide uptick in natural gas storage activity. Notably, the Mountain region experienced the most substantial gain, driven in part by colder-than-normal weather during the 2023–24 winter. The increased demand for heating gas spurred higher injection levels in the following months, boosting peak storage figures.
In the Pacific region, regulatory action also played a critical role. In August 2024, the California Public Utilities Commission approved a 67% increase in authorized working gas capacity at the Aliso Canyon storage facility, raising its maximum volume to 69 Bcf. This adjustment significantly contributed to the region’s higher demonstrated peak capacity.
By contrast, the South Central and East regions saw minor declines in working gas design capacity, primarily due to base gas adjustments. Base gas refers to the volume of gas that must remain in a storage reservoir to maintain pressure and deliverability, and increases in this component effectively reduce the volume available for working gas. In the East region, base gas adjustments resulted in a 5 Bcf reduction in working gas capacity.
Peak vs. design capacity: Two sides of the storage equation
The EIA evaluates storage capacity through two primary metrics:
- Demonstrated peak capacity captures the highest actual storage volumes achieved at each site over a five-year window. Because this measure is grounded in operational history, it often falls short of theoretical design limits.
- Working gas design capacity, on the other hand, represents the maximum gas volume a facility is engineered to hold and cycle through under regulatory and operational guidelines. This figure is based on factors such as reservoir characteristics, installed equipment, and operational plans certified by regulators.
While the demonstrated peak capacity reflects real-world flexibility and usage patterns, the design capacity offers insight into the structural limits of the U.S. natural gas storage network.
MAGAZINE
NEWSLETTER


CONNECT WITH THE TEAM