Read this article in Français Deutsch Italiano Português Español
IEA tracker highlights wave of LNG export growth
June 09, 2025
Online tool monitors post-FID capacity buildout
The International Energy Agency (IEA) has launched an online LNG project tracker that maps the development of liquefaction capacity worldwide, spotlighting a historic wave of growth set to reshape global gas markets through the end of the decade.
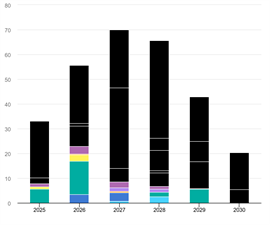
According to the IEA, nearly 290 billion cubic meters per year (bcm/yr) of new LNG export capacity is expected to come online between 2025 and 2030 from projects that have already reached final investment decision (FID) or are under construction. This marks the largest expansion phase in LNG history and could significantly alter global supply dynamics, particularly amid shifting investment patterns and geopolitical uncertainties.

The new LNG tracker offers real-time data on post-FID project activity and ramp-up timelines, helping market participants gauge the likely evolution of liquefaction capacity through the end of the decade. It comes at a time when the LNG sector is emerging from a multi-year investment surge that began in 2019 and briefly stalled during the COVID-19 pandemic.
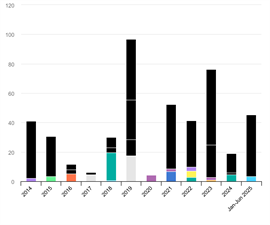
From 2019 through June 2025, more than 335 bcm/yr of export capacity reached FID globally—more than double the average annual capacity sanctioned during the 2014–2018 period. This investment wave has been led by the United States, which has accounted for nearly half of total new liquefaction capacity approved since 2019. Qatar is the second-largest contributor, representing about 20% of total FIDs, with the remainder spread across a dozen countries in the Middle East, Africa, the Americas, Asia Pacific, and Russia.
Shifting geographies in FID leadership
The IEA data reflects a major shift in the geography of LNG development. During 2022 and 2023, North America—especially the United States—dominated global LNG investment decisions, responsible for about 75% of sanctioned capacity. The surge was driven by high spot prices and strong global demand for U.S. LNG’s flexible contract structures.
But by 2024, the trend reversed. Over 75% of global LNG FIDs that year originated in the Middle East, while no new U.S. projects reached FID amid cost inflation, oversupply concerns, and a temporary freeze on permit approvals. That changed in early 2025 when the U.S. permitting pause was lifted, sparking a fresh wave of project announcements.
Between January and June 2025, the U.S. once again led the industry, accounting for more than 90% of newly sanctioned capacity. Among the key developments were FIDs for Louisiana LNG in April and Argentina’s Southern Energy FLNG in May. Construction also began on the first phase of the CP2 LNG project in June, even though a formal FID has not yet been confirmed.
Capacity outlook and key projects
Annual LNG liquefaction additions are projected to ramp up from about 33 bcm/yr in 2025 to a peak of nearly 70 bcm/yr in 2027, according to IEA estimates. Output growth is then expected to gradually taper through 2030.
More than half of the incremental capacity in 2025 is forecast to come from the Plaquemines LNG project in Louisiana, which delivered its first cargo in December 2024 and is ramping to full production.

While the overall buildout is substantial, the IEA notes it does not include several large, approved projects that are currently stalled. Russia’s Arctic LNG 2, for example, is technically complete on Train 1 and nearing completion on Train 2, but Western sanctions have blocked commercial operations and halted work on Train 3. Mozambique LNG, suspended in 2021 due to regional unrest, may resume construction in mid-2025, while Qatar’s North Field West expansion has been approved but has not yet advanced to FID or construction.
Any progress on these shelved projects, or the approval of new developments, could significantly alter the supply outlook. Conversely, delays at active construction sites or reduced output from legacy LNG exporters in Australia, Nigeria and Indonesia could constrain supply growth in the latter half of the decade.
Implications for global gas markets
The sheer volume of new capacity coming online over the next five years will play a central role in shaping the global gas market’s balance, the IEA said. With LNG serving as a critical swing supply for both Asia and Europe, changes in liquefaction capacity have broad implications for pricing, trading dynamics and long-term contract negotiations.
The IEA also emphasized the highly cyclical nature of the LNG sector. Project lead times average four to five years between FID and first cargo, creating multi-year gaps between investment waves and market responses. This makes transparent, real-time tracking tools like the LNG project tracker increasingly valuable for analysts and investors seeking to navigate the evolving energy landscape.
MAGAZINE
NEWSLETTER

CONNECT WITH THE TEAM


