

Natural gas spot prices climb in U.S., report shows
October 01, 2021
Natural gas spot prices in most U.S. hubs have climbed in late September as demand outstripped supply in most regions, a recent report from the U.S. Energy Information Administration shows. The spot price for gas at Henry Hub rose from $4.83/MMBtu to $5.63/MMBtu in late September.
The October 2021 Nymex contract expired in late September at $5.841/MMBtu, up $1.04/MMBtu from the previous week. The 12-month strip from November 2021 through October 2022 averaged $4.507/MMBtu, up 34 cents from the previous week.
Net injections of working gas in the U.S. reached 88 Bcf for the week ending Sept. 24. Working natural gas stocks totaled 3170 Bcf, 15% lower than one year ago and 6% lower than the five-year average for the week, the EIA reported.
Natural gas markets on the U.S. Gulf Coast remain tight despite a decline in power consumption caused by cooler weather and reduced demand for air conditioning. Demand for gas among power producers in the fell by 910 MMcf/d in Texas and 890 MMcf/d in the Southeast, according to data from IHS Markit.
The reduced demand for gas from power producers was offset by deliveries to LNG export terminals, the EIA reported. Gulf Coast LNG export terminals have returned to full capacity after the effects of Hurricane Nicholas have passed.
Gulf Coast gas production remained impaired in late September because of impacts from Hurricane Ida, which landed on the Texas coast one month earlier. Supplies are restricted in part because of an ongoing outage at a Shell-operated West Delta 143 platform. The offshore platform aggregates oil and gas flows from Shell0perated offshore Olympus Mars and Ursa fields was damaged from Hurricane Ida. Production from the fields is not expected to normalize until the first quarter of 2022, Shell reported.
Meanwhile, Enbridge, the operator of the Mississippi Canyon Gas Pipeline that brings gas onshore from Shell’s WD-143 platform reported that the Venice natural gas plant is operational, but not receiving feed gas. Prior to the hurricane, Enbridge reported gas flows of about 120 MMcf/d from Olympus, 270 MMcf/d from Mars and Ursa combined. Flows from the three fields remain zero as of late September.
Meanwhile similar factors have led to a restraint in supply at other U.S. hubs. At the Chicago citygate, prices rose 64 cents to $5.29/MMBtu in late September as demand for gas from power generators outstripped available supplies.
Demand for gas from power generators in the Midwest rose above 2.8 Bcf/d in late September, according to IHS Markit, up more than 1.2 Bcf/d from mid-September.
The price of gas at PG&E Citygate in Northern California rose 31 cents to $7.03/MMBtu in late September. The increase in gas prices in California was less than other hubs because that market remained more in balance, the EIA reported.
However, prices in Southern California were volatile in late September and expected to remain that way through mid October after SoCal Gas issued a critical notice in late September that announced the start of maintenance at the Aliso Canyon storage facility.
That facility is the largest gas storage facility in the region and will not have capacity for storage injections or withdrawals until the maintenance is complete. This notice exacerbated the ability of storage to balance changes in supply and demand in southern California, the EIA reported.
Tight markets in Europe, Asia
International gas prices have also climbed in response to the same factors shown in the U.S. Swap prices for November LNG cargoes in East Asia to an average of $27.96/MMBtu in late September, the highest since January 2020. Spot prices at the Title Transfer Facility in the Netherlands averaged $25.23/MMBtu the highest since September 2007, the EIA reported.
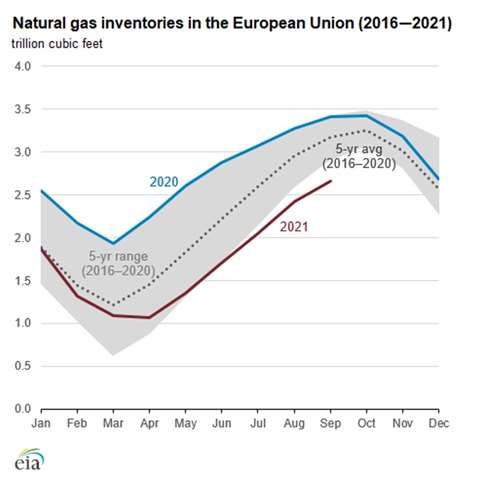
Working natural gas inventories in Europe have held relatively low so far during this year’s injection season, which is defined as April through October. Total inventories reached 2.7 trillion cubic feet (Tcf) as of Sept. 28, or 74% of storage capacity, according to the Gas Infrastructure Europe’s Aggregated Gas Storage Inventory.
As of late September, total inventories were 0.75 Tcf, or 22% below last year and over 0.5 Tcf, 16% below the five-year average for this point in the year.
After a mild 2019–2020 winter and low natural gas consumption through 2020 as a result of COVID-related impacts on economic activity, Europe started the 2020–21 heating season relatively well supplied, the U.S. Energy Information Administration reported.
However, colder than normal weather late in the 2020-2021 heating season and a cold spell in April, led to rapid drawdowns of natural gas inventories earlier this year. As a result, Europe’s gas inventories started the 2021 injection season 11% below the previous five-yar average, and 44% below the record-high storage inventories in 2020.
The GIE reported gas inventories are particularly low in Austria, Germany and the Netherlands, where stocks were 42%, 29% and 35% lower than the same period one year ago. Compared to the five-year average for late September, Austria’s stocks were 38% lower while Germany was 26% lower and the Netherlands were 35% lower.
Gas stocks at facilities owned by Russia’s Gazprom in Austria, Germany and the Netherlands reached a total of 77 Bcf in late September, 75% below the five-year average. Gazprom’s gas storage assets account for about 11% of the total storage capacity in the European Union.
Several factors account for the lower level of European gas inventories. An ongoing decline in Europe’s natural gas production is one factor, with production falling 9% year-over-year. The fall in production, in turn, is caused by the depletion of existing European fields and no significant new discoveries. Total production from the region is 19% below the five-year average.
Pipeline imports, primarily from Russia, have fallen. An explosion at a major gas processing facility in northern Russia has led to a decline in gas supply during the injection season. In addition, lower liquefied natural gas (LNG) imports have led to a decline in inventories in Europe.
A strong economic recovery in Asia has increased competition from spot LNG cargoes, particularly from the U.S. Imports of LNG at Europe’s terminals reached a three-year low, averaging 7.2 Bcf/d from April through September, down 18% from the 2020 average and 22% lower than last year, according to data from the GIE.
Meanwhile, outages at LNG production facilities in several countries have reduced global LNG supply, particularly in the summer. Taken together, these factors have led to a surge in LNG spot prices, which have exceeded $30/MMBtu in both Europe and Asia at the end of September.
Updated data for 2020
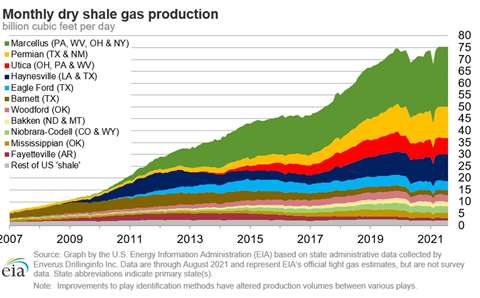
The EIA’s 2020 Natural Gas Annual updated preliminary figures released earlier this year and repeated previous assertions that dry gas production fell in 2020 after reaching a record high in 2019. It was the first time since 2016 that annual dry gas production declined. Consumption also declined in 2020 after hitting a record high in 2019.
Domestic dry gas production in 2020 was 33.5 Tcf, or 91.5 Bcf/d, down 1.5% from the previous year. Producers in Ohio saw the largest decrease in annual production, falling 10.6% in 2020 to 6.4 Bcf/d. Producers in Oklahoma reported a decline of 8.3% in 2020, while West Virginia saw the largest increase in production, jumping 20.6% from 2019, the EIA reported.
Deliveries of natural gas to consumers were 30.5 Tcf, or 83.3 Bcf/d, down 2.4% from 2019. Four of the five sectors – residential, commercial, industrial and vehicle fuel – saw a decrease in deliveries to consumers in 2020. The electric power sector reported an increase in consumption.
U.S. exports of natural gas increased for the sixth consecutive year in 2020, according to revised statistics released recently from the Energy Information Administration.
Total natural gas exports reached 14.4 Bcf/d in 2020, up 13.1% from the previous year and higher than any previous year dating back to 1973. The U.S. exported natural gas to 38 countries in 2020, the highest ever and up from 37 countries in 2019 and 33 countries in 2018.
For the fourth consecutive year, the U.S. was a natural gas net exporter, meaning that total exports exceed total imports. In 2020, the U.S. exported 7.5 Bcf/d while imports were 7.0 Bcf/d.
MAGAZINE
NEWSLETTER


CONNECT WITH THE TEAM