Less Underground Storage Capacity: EIA
April 18, 2019

Underground natural gas storage capacity in the Lower 48 states as well as in most U.S. regions have declined slightly in 2018 compared with 2017, according to a recent report from the U.S. Energy Information Administration (EIA).
The two ways that EIA measures working natural gas storage capacity are design capacity and demonstrated peak capacity. Design capacity, sometimes referred to as nameplate capacity, is based on the physical characteristics of the reservoir, installed equipment and operating procedures on the site, and often must be certified by federal or state regulators. It is calculated as  the sum of reported working natural gas capacities of the 380 active storage fields as reported on survey Form EIA-191, Monthly Underground Natural Gas Storage Report, as of November 2018. This metric is a theoretical limit on the total amount of natural gas that can be stored underground and withdrawn for use, EIA said.
Demonstrated peak capacity or total demonstrated maximum working gas capacity, represents the sum of peak monthly working natural gas volumes observed, by field, during the most recent five-year period, regardless of when the individual peaks occurred. The most recent demonstrated peak looks at the months of December 2013 through November 2018. Demonstrated peak capacity is based on survey data from Form EIA-191 and is typically lower than design capacity because it relates to historical, actual facility usage, rather than potential use based on the design of the facility.
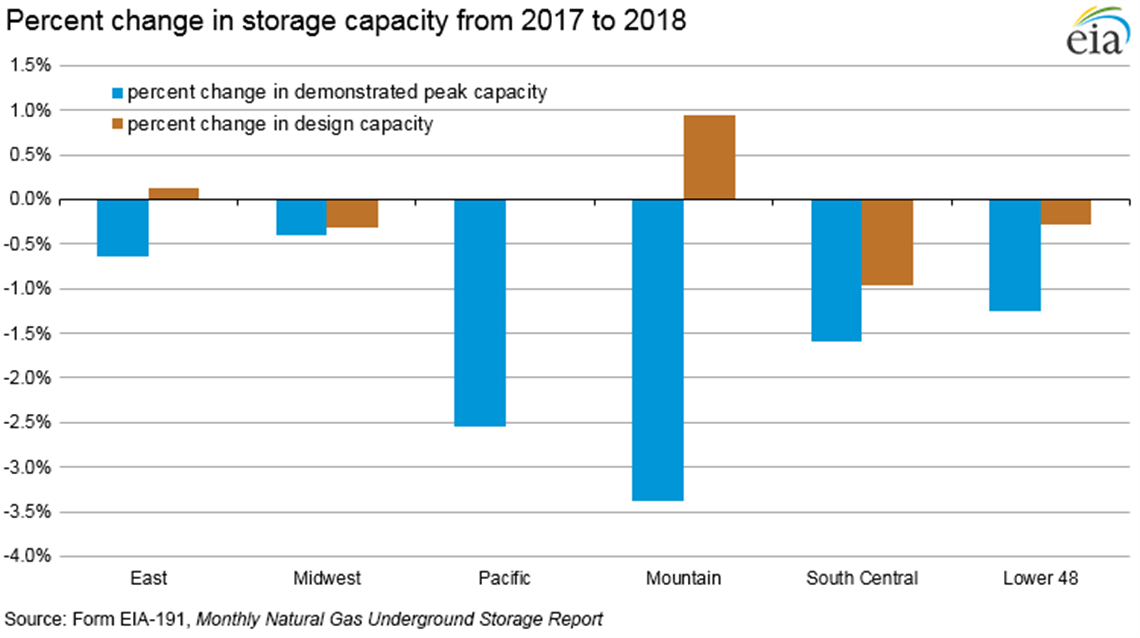
Design capacity of underground natural gas storage facilities was essentially flat or decreased slightly in most storage regions in November 2018 compared with November 2017, with the exception of the Mountain region where it increased by 0.9% or 4 bcf. The increase in the  Mountain region is the result of the East Cheyenne field reclassifying about 4 bcf of base gas to working gas when it started reporting the West Peetz and Lewis Creek fields as one facility. The West Peetz/Lewis Creek facility was the only facility to expand by more than 1 bcf design capacity during the report period.
By contrast, design capacity in the South Central Salt region fell by 2.4%, or 12 bcf. The decrease was mostly driven by capacity reductions at the Egan Storage Dome in Louisiana and the Tres Palacios facility in Texas. For the fifth consecutive year, no new facilities entered service in 2018. New facilities could have increased design capacity.
Demonstrated peak capacity fell in every region, EIA said. Demonstrated peak storage capacity decreased in every region, down by 1.2%, or 54 bcf, for the Lower 48 states as of the November 2018 report period (from December 2013 through November 2018) compared with November  2017 (from December 2012 through November 2017). The demonstrated peak for 2018 was 4263 bcf, down from 4317 bcf in 2017. The decrease was driven largely by the South Central region, which fell by 23 bcf, but the demonstrated peak fell by 5 bcf or more in all five regions. Several trends may be reducing the need for underground storage buildout:
Overall higher levels of natural gas production, compared with production a few years ago, reduced reliance on storage services for some customers to meet their natural gas needs. Production growth was driven by increased production in the Appalachian Basin, the Permian Basin, and the Haynesville shale formation.
In recent years, the difference in the price of natural gas between the winter and summer has been structurally shrinking, decreasing from more than $0.50 per MMBtu within the last 10 years to less than $0.20/MMBtu for much of 2018. This narrower difference has reduced the economic incentive to invest capital expenditures in increasing natural gas storage infrastructure, EIA said.
Midstream infrastructure buildout, such as pipelines and compressor stations, has enhanced grid interconnectedness and flexibility, allowing natural gas to more easily reach end users, and consequently reducing dependence on injections and withdrawals from storage.
 However, the EIA report said several trends are tightening available supplies or increasing need for additional storage.
– The United States now exports significant and growing volumes of both liquefied natural gas and natural gas via pipeline to Mexico, that exhibit variability with respect to weather and price.
– The growth of natural gas-fired electricity generation continued in 2018. July 2018 holds the record for the most natural gas consumed in the U.S. electric power sector in a single month. Both electric sector natural gas consumption and total natural gas consumption reached their highest-ever annual levels in 2018.
– In the West Coast region, California faces ongoing issues related to infrastructure and storage limitations, as well as regulatory issues, largely as a result of the Aliso Canyon storage facility leak in late 2015.
For the fifth consecutive year, no new natural gas storage facilities began operating in 2018. Any increases in working gas design capacity for the period came entirely from expansions of existing facilities and reclassifications of base gas to working gas. In addition, two facilities became inactive in 2018, the Chevron Phillips Clemens field in Texas and the Oneok Osage/Burgess field in Oklahoma. These two facilities accounted for about 2.6 Bcf of design capacity.
EIA considers a storage field inactive when its working gas has been depleted and the respondent confirms that the field will not be used in the coming calendar year and/or will be decommissioned or plugged. The East Cheyenne/Lewis Creek facility is also no longer listed as an active storage facility because its volumes are now included in the West Peetz/Lewis Creek combined facility.
MAGAZINE
NEWSLETTER

CONNECT WITH THE TEAM


