

The power of descriptive data analytics
May 31, 2022
 (Image: Reuters)
Data! Now if your first reaction to that word is remembering the sentient android from the Star Trek: The Next Generation series, then clearly you are an awesome person. But, for this article, data refers to information that is in a form that allows it to be communicated, manipulated, processed, and stored.
In the gas compression industry, many company IT/IP Teams, along with automation & controls teams, have implemented impressive systems for defining what site data is desired, handling missing or corrupt data, determining data validity, storing data, and using it for active control, issuing alarms, enacting shut down events, trending sensor data, running diagnostics, analyzing failures, and more.
At the station level, high volumes of (near) real-time data are collected and used for operations and safety. For some data streams, this can include tens of thousands of data points per second (e.g., pressure-volume data and station vibration data). Often this massive amount of data is stored on local servers in case forensic reviews must be done (e.g., unexpected shut down events and/or failure analysis). However, often after a few hours or days, the older data is overwritten with newer data so that the server’s storage capacities are not exceeded.
In contrast, recording a station’s historic data for later analysis typically involves sending a snapshot of specific (and much smaller) datasets to an offsite location where that reduced data is stored for many years. Often these snapshots might be triggered on time (e.g., once a second, once every 10 seconds or once a minute) and/or triggered on unit hardware changes (e.g., whenever a load step change is made) and/or triggered on deltas (e.g., whenever speed changes more than 5 rpm). The goal is to collect enough data from the unit and its operating performance to be useful to others, but not to collect so much data that storage and bandwidths are overwhelmed.
Once unit or station data is uploaded to storage (these storage servers are often referred to as historians), then this is quintessentially the starting point for Big Data. Oxford Dictionary defines Big Data as “extremely large data sets that may be analyzed computationally to reveal patterns, trends, and associations[.]” This is the level where names like OSI PI, Siemens, Oracle, IBM, Amazon, GE, Azure, and others start popping up.
Data analytics experts manage this data and develop interfaces that allow supervisors, reliability managers, and management the ability to check the status, health, historic use, and other key indicators of the company’s compression assets.
The actual equipment and sensors are at the fundamental level (metallurgy, combustion efficiencies, thermodynamics, cyclic fatigues, component tolerances, chemical reactions, etc.), the operators and controls are at the operational level (operations, power management, maintenance, process control, etc.), and management is at the strategic level (asset utilization, predicting future usage, controlling corporate revenues and costs, etc.). Understanding the system via appropriate tools for Big Data gives management the insight they need to meet their goals.
Descriptive vs diagnostic analytics
Data analysts are challenged with providing tools to others to use to gain insights into company assets. To achieve this, data analysts often start by implementing two fundamental analytics: descriptive and diagnostic analytics. Descriptive analytics provides a user with knowledge about events that have happened in the past, while diagnostic analytics helps the user better understand why such past events happened. These two analytics are generally straightforward to implement, and they provide a powerful tool to users to identify when and likely why events happened. Many of us have learned that it is not wise (or profitable) to repeat past failures.
But there are two additional levels of data analytics: predictive and prescriptive analytics. Predictive analytics helps a company’s asset management team identify potential results, solutions or actions, while prescriptive analytics takes those proffered solutions and then creates specific, action plans that can be implemented to make those solutions materialize. While these two analytics are more arduous to implement, they provide extremely powerful tools to users to develop knowledge of what is possible and paths forward to achieving those possibilities.
Successful implementation of predictive and prescriptive analytics usually involves subject matter experts (SME’s), accurate and accessible compressor models (i.e., digital twins), knowledge of the full piping system with restrictions, contractual obligations, costs, consequences and many other key items. After reading a few books, attending a few conferences, watching a few webinars, and working alongside some seasoned experts, mastery of predictive and prescriptive analytics should be within grasp. This can take a few months to a few years!
My mentor, Ed Miller, was keen on the proverb “How do you eat an elephant? One bite at a time!” So, while a full coverage of how to tackle predictive and prescriptive analytics is beyond the goal of this article, we can tackle one important function (one bite): predictive analytics – how to implement prediction.
A common approach to prediction is via trending data. A user might use some graphics software to plot historic data, then create a trendline from that data, and from that trendline “predict” where the system appears to be headed. This is a great way to do some simple predictions. However, used indiscriminately, it can lead to unrealistic expectations, false alarms, expensive shut down events and more.
For example, a first-stage cylinder’s max allowed pressure (MWP) is 1000 psig (68.95 barg), and the current data trend is showing that stage’s discharge pressures started at 600 psig (41.37 barg) and have been climbing about 50 psi (3.45 bar) every day, and now those discharge pressures are about 942 psig (64.95 barg). Does this mean that the unit will exceed its first stage maximum discharge pressure within the next day, and hence someone needs to fix this problem ASAP or at least shut down the unit? No, not likely.
More likely is that the unit’s PLC (programmable logic control, e.g., Allen Bradley) is currently using a specific load step to meet the station’s operational needs. However, if and when the stage’s discharge pressure hits the first stage MWP, the PLC will automatically change to a different load step that reduces the first stage discharge pressure.
Data analytics teams must develop different approaches to handle situations for which simple trending is insufficient or ineffective. One such approach is to trend the differences between what the unit was doing versus what it should have been doing. When the delta is trended, a user can quickly and more accurately interpret a unit’s condition: if what was measured matched well to what was expected (and hence trendline relatively flat), then all is as expected (and hence statistically good).
Referring to the previous example, if the first-stage measured discharge pressures matched well to the first-stage theoretically predicted discharge pressures (which are the ones used to control the unit), then the results help vindicate that the operators or control panel (or both) were keeping the unit safe – which is their area of expertise.
Dynamic models
Another example of predictive analytics would be that of determining the extent compression assets were underutilized at a station. If your dashboard shows that the four units running at the station were only operating at 85% load, does that mean that the units are 15% below ideal utilization? The answer can be Yes, or it can be No. If those units are loaded as high as possible for the current pressures, and that still only requires 85% load on the driver, then the answer is No – they are at 100% utilization. However, if those units could load more (close some clearance pockets and/or active some ends) then the answer is Yes, they are underutilized – but by how much? 1%, 5%, 10%, or the full 15%?
An ideal approach for addressing this type of question is by having an accurate and dynamic model of the compressor units available right there within your big data (e.g., integrated into your OSI PI system) that allows the data analytics team to determine what are the maximum load potentials for each unit based on current operating pressures. While there were no viable options to add interactive compressor modeling directly to systems like OSI PI a few years ago, this has changed. Now, those options are commercially available.
For this example, station personnel opted to limit engine load to 85% to help reduce wear and tear on the engines, since maintenance costs come from their budgets. Now, with predictive analytics, management can see what potential costs to the company can be. In this case, as Table-1 shows, saving a few thousand dollars each year at the station level can cost the company lots (i.e., millions) in lost potential income.
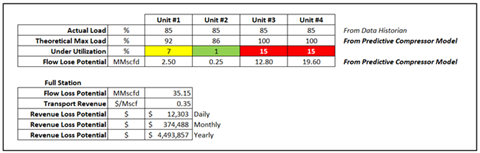 Table 1
As company data analysts complete Descriptive and Diagnostic Data Analytics and move up to Descriptive and Prescriptive Data Analytics, there are now commercially available tools that can make this experience smoother, faster, more powerful, and more effective. This allows Management to see beyond what was and what is, and start to see what could be and what should be. And this insight allows them to better achieve their asset management goals.
About the author
 Dwayne A. Hickman
Dwayne Hickman graduated from The Ohio State University, taught college courses in mathematics and computer science for 13 years, designed and published educational software, and has spent the last 25 years in the reciprocating compressor industry.
Hickman has developed several reciprocating compressor performance software packages, including software for seven major OEMs. He has presented numerous technical papers and short courses at the GMC, IPC, GSRMS, and EGCR, has written many articles for both COMPRESSORTech2 and Pipeline & Gas Journal, and has served as a GMRC Training Specialist.
Hickman is the VP of eRCM Product and Solutions at ACI Services, Inc., located in Cambridge, Ohio, and is the chairperson of the GMC Planning Committee.
MAGAZINE
NEWSLETTER


CONNECT WITH THE TEAM