

Keeping Murphy’s Law in check for TCO
July 20, 2020
Harry Lankenau explores how accessing deeper compressor knowledge to minimize disruptive impacts on service lifecycle management.
End users of equipment, which piston compressors are part of, request a warranty or at least a reliable assessment of the total cost of ownership (TCO). The expected expenses of the machine over a period of many years, or even over the complete lifetime, can be a real challenge because machinery may run for several decades.
The tool for the TCO assessment is the service lifecycle management (SLM), which is concerned with services that accompany the production process with its plants, machines and tools. Specifically, service intervals and the necessary activities are to be managed and analyzed.
The TCO can only be determined and guaranteed by the machine manufacturer if they have sufficient information about the operation and the resulting cost factors.
There are potential disruptive impacts such as major machinery failures resulting in expensive repair expenses. The worst case scenario could lead to the outage of a large production section or even the complete plant.
Equipment monitoring has been utilized to control chemical processes with alarm and shutdown signals to prevent critical scenarios. Figure 1 shows a typical signal storage device widely utilized in the past.
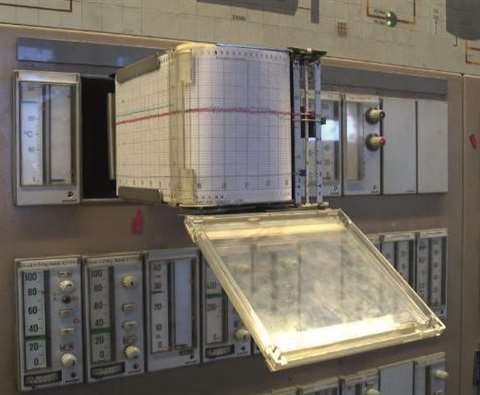 Figure 1.1. Past days signal trending
To significantly improve the safety of equipment, online or condition monitoring was developed to record and store masses of data, including “fast” signals with a scan rate in the kHz range, as well as vibrations, real-time piston rod movement, cylinder pressure cycles (and derived pv-cards) among others.
Supplementary calculation tools conduct some kind of data evaluation to recognize mechanical overload or thermodynamic off-sets. The alarm and shutdown signals also provide additional safety and should stop the machine before complete destruction.
The vast amount of data makes it practically impossible for operators in the control room (Figure 1.2) as well as remotely organized monitoring service companies to follow the development of a machine to assess the quality of a vibration signal, or to recognize if a cylinder pv-card is still acceptable or already indicating a bad or even dangerous condition.
This paper provides options for accessing deeper compressor knowledge to minimize disruptive impacts on the SLM.
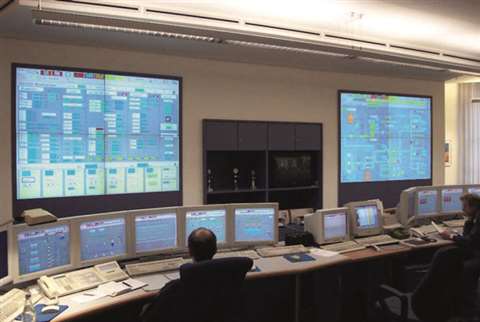 Figure 1.2. Control room with vast amounts of data displayed on several monitors
Condition management
The tool to control or even avoid disruptive impacts on the service lifecycle management is condition management, which is a term combining the following items under its roof:
Condition monitoring
- Description of the actual machine condition
- Supplementary calculations to extend the technical knowledge and provide an overview of the machine operation
- Definition of safety/alarm and shutdown levels to ensure machine protection in case of signals getting out of range
Limitation: Condition monitoring speaks up if something is wrong with the equipment, but it does not usually explain why.
Equipment condition analysis
- Permanent transfer of condition monitoring data into an evaluation and assessment software
- Analysis of the equipment condition development, long before a potentially critical situation emerges
- Observation and trending of the wear development to define time maintenance activities and spare part logistics
- Automatically sending out condition reports to operators and reliability engineers on a regular (e.g. monthly) basis or in case of actual need
Maintenance management
- Set up maintenance schedules based on the above, for the just-in-time maintenance (Figure 2.3)
- Consideration of service contracts with the OEM to be sure to have the required service personnel at site when the overhaul starts
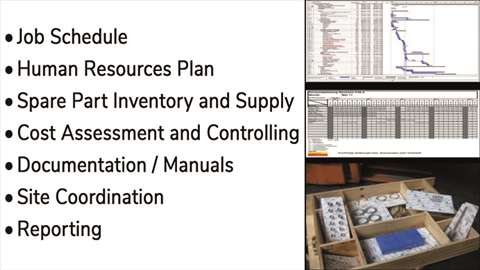 Figure 2.3. Example of a maintenance project plan
Spare parts logistics
- Awareness of the necessary spare parts with adequate replenishment of the stock
- Order spare parts promptly before required (potentially long delivery times taken into consideration)
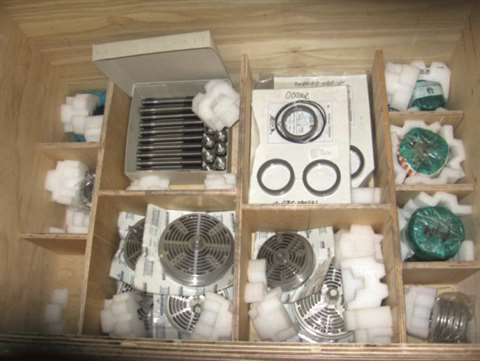 Figure 2.4. Typical consignment stock box
Conclusion
Condition monitoring systems are widely available through numerous suppliers, who continue to improve the product.
Maintenance management and spare parts logistics can be organized once the relevant conditions are defined.
The missing element is the comprehensive equipment condition analysis in terms of software that is automatically handing out “bulletins” of the actual machine condition with recommendations – or even warnings – when maintenance activities are due.
Condition management analysis
The real key factor of condition management is the permanent online equipment condition analysis.
The basic idea of this analysis concept is to put all thoughts and considerations of operations personnel as well as reliability and construction engineers into a software tool. This tool utilizes data trends and permanently conducts relevant compressor unit assessments.
If a machine is damaged then generally personnel investigate why something happened and they try to determine when. They review masses of data and trends, creating cause and effect charts or Fishbone schematics. All of this happens under pressure as the machine needs to be repaired and go back into service as soon as possible.
That energy is better spent before a machine comes apart when an engineer can fully understand the equipment development, its wear patterns and list all potential consequences.
- Involvement of the OEM in terms of consignment stocks (Figure 2.4) to ensure the correct number of parts are available
A computer with adequate software is naturally much faster than an engineer in analyzing the process and machine data. Despite the computer’s processing advantage, an engineer remains the last person to decide what to do. But digital assistance should be provided.
The equipment condition analysis software not yet exist as we have to digitalize Murphy’s Law.
Key elements of the equipment condition analysis software
For an automated condition diagnosis, apart from sufficiently reliable input data, the precise characterization of the compressor is important.
It must be known whether the compressor is a single or multi-stage unit, whether it works with or without cylinder lubrication, among other factors. Even flow control, such as suction valve unloaders or speed control, can considerably influence the behavior of a compressor.
Regarding a profound health assessment, there are a number of diagnostic approaches.
Thermodynamic integrity (polytropic exponent trending)
The compression cycle is subject to a relatively simple thermodynamic basic law that describes the relationship of four process parameters of a compressor stage: Suction and discharge pressure as well as suction and output temperature. The thermodynamic relationships are shown in Figure 4.1.1.
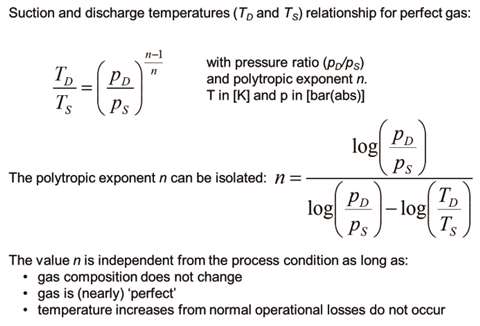 Figure 4.1.1. Polytropic exponent definition
This relationship can be described as “thermodynamic integrity”. If all parameters can vary depending on the type of machine and operating mode, it may be difficult to differentiate between an abnormal deviation and a normal process variation.
The polytropic exponent can be very helpful in detecting an abnormality. Its trend can show whether or how the machine condition changes. A powerful indicator is available, which can determine when maintenance might be required.
Figure 4.1.2 depicts the trend of the polytropic exponent for two machines over a time period of seven years, practically the lifetime of the two compressors since their commissioning.
The violation of the above thermodynamic rule was due to piston ring gas slippage that brought compressed hot gas into the opposite cylinder end during its suction phase, increasing the temperature of the gas inside the cylinder with consequentially elevated discharge temperature. The upward slope of the polytropic exponent made it visible.
The polytropic exponent has often proven to be reliable for the trending of piston ring wear and predicting the end of the machine’s operation.
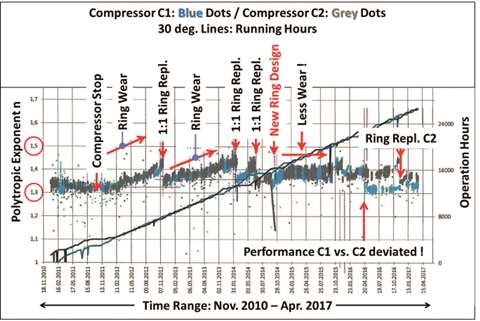 Figure 4.1.2. Long-term polytropic exponent
Trend gradient analysis
Process data trends are usually low frequency, quasi-static trends that can be characterized in three groups:
- the steady;
- the fluctuating, and;
- those derived from high-frequency signals through triggering to generate an average value and, thus, a “slow-motion” trend line.
If a steady trend moves out of range, it might easily be recognized.
Then questions arise:
- how fast does the offset develop?;
- is the situation abnormal but still acceptable for some time? and;
- if propagating in none linear form is the situation already critical?
The understanding of what is slow and what is fast can be derived from long-term statistical data indicating how amplitudes usually look over time. This provides for an automatable tool that allows detecting an unusual trend development
The example in Figure 4.2 does not seem to be of significance, but it was. Fluctuating trends and those derived from fast data are difficult to assess on their own if they get out of hand.
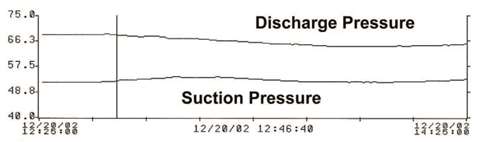 Figure 4.2. Beginning of pressure trend change
Efficiency parameter calculation
Drive power consumption (input) and compressor gas flow delivery (output) are thermodynamically related, with various efficiencies and mechanical effects, such as friction and other losses. Therefore, the ratio of absorbed power and gas delivery in kWh/Standard-m3 can be monitored as a trend and is quality assessed. It can also be compared with theoretical, calculated design data.
Parameter divergence analysis
There are measured values with reciprocating compressors, being very simply related to each other. Two suction valves of a cylinder should normally show approximately the same temperature. Although there are various reasons why this may under certain circumstances not be the case, a parameter divergence analysis and the trend of a temperature difference helps evaluate the situation.
Detecting potential valve damage, which typically manifests itself in a local temperature increase, is part of such an assessment.
Figure 4.4 shows four suction valve temperatures that should and had been nearly equal, but started to deviate at a certain time that indicates a suction valve issue. From the usual trend (top graph of Figure 4.4), the incident could not be recognized. Only the zoom revealed the poor condition.
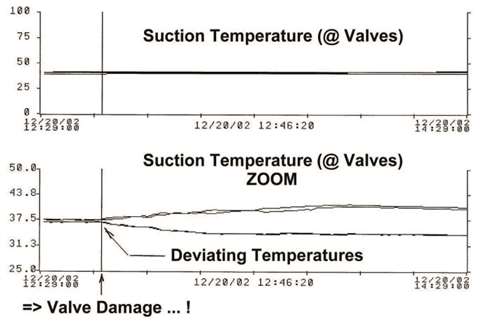 Figure 4.4. Abnormal valve temperature deviation
pv-divergence analysis
There are clear rules regarding the cause and effect of a cylinder pressure-over-volume (pv-) diagram deviation.
Unfortunately the analysis is not always so easy because multivariate factors have an impact on the pv-diagram shape without any indication of which parameter is the leading source of the change. The pv-divergence analysis goes through all these rules and compares deviations with other potential irregularities to narrow down to the most likely source of error.
It should be noted that pv-data are of the type “fast and high-frequency signals”, which are not always available because efforts to obtain are high and predominately found at process gas compressors with large monetary impact.
Piston rod drop measurement
Piston rod drop measurement – as outlined in Figure 4.6.1 – has become a standard for horizontal compressors to measure the rider band wear, and recognize when it is time to replace the same.
The proximity probe constantly measures the distance to the piston rod, practically in real time. Therefore, rod drop signals are also fast/high-frequency signals.
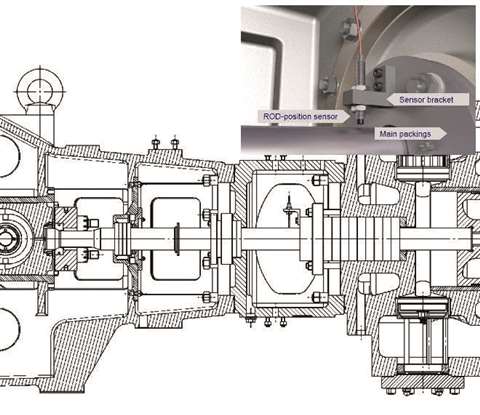 Figure 4.6.1. Piston rod drop sensor arrangement
To be able to depict the rod drop measurement in terms of a quasi-static trend, the signal is triggered – usually once per crankshaft revolution – converting the fast data into comparably slow-motion signal trends.
The ability of practically every probe arrangement to show the real-time piston movement, on its back and forth travel between the piston top and bottom dead center, is hardly utilized. It can indicate if the rod, as well as piston and crosshead, is smoothly running or bouncing. Figure 4.6.2 shows a rod movement curve that had been obtained from a two-stage piston compressor hydrogen unit.
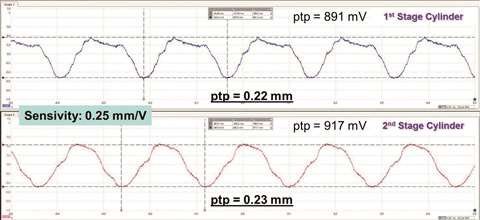 Figure 4.6.2. Real-time piston rod movement curve
A simple oscilloscope is good enough to temporarily pull such rod movement signals from the proximity junction box. Too little data of the latter application are known yet to be able to draw reliable conclusions from such rod movement patterns. The rod movement measurement is rarely seen on vertical compressors.
Other than for horizontal machines – where the weight of the piston, the rod and the crosshead provide for a more or less stable rod movement – the same on vertical machines is less stable. This is because the rider band and crosshead clearance might allow for rod movement envelope with larger yet normal tolerance than applicable for rider band wear. This means that the measurement might become insignificant.
There are, however, potential damage cases where the rod might be pushed aside more than any of the a.m. tolerances. The rod movement trending does provide a life-saving signal. This also applies to the vertical compressor type.
Analysis correlation
The correlating analysis is required to clarify if a parameter deviation is abnormal or not. But need to establish whether a temperature deviation is normal due to suction valve unloading? And does a deviation of the parameter A fit to that of B?
For the given example, the flow capacity drop per Figure 4.7 – which on its own might not be abnormal at all – must be looked at in line with the suction valve temperature deviation as shown in Figure 4.4. It shows that flow and suction/discharge pressure trend changes are not normal, but the consequence of a valve failure.
This type of cross-referencing is a vital contribution to almost all other analyses described. It is also part of the compressor characterizing, required for a reliable root cause analysis.
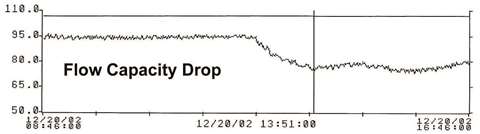 Figure 4.7. Abnormal flow capacity drop
Vibration-correlation analysis
This type of analysis takes into account that a machine’s vibration is dependent on the operating conditions (gas, pressures, temperatures, speed, SV unloading, load condition) and can have several variations. This analysis might help to determine adjustable rather than fixed, vibration alarm and shutdown levels.
Machine history
The basic requirement for condition management is a thorough understanding of the individual compressor, including its history.
Some questions include:
What kind of “teething troubles” did the machine have to deal with?;
What “aches and pains” are known?;
What issues did occur?;
How many times did they occur? and;
What was found and how did the issue develop with time?
If a machine is already “sick”, it is practically impossible to determine the TCO. The equipment must be restored to a healthy condition first.
Data visualization
In addition to acquisition, processing and evaluation of process data, its visualization is an important factor. Algorithms and software can and should not replace the ultimate instance, the human interface. Intuitive visualization of analyses must be the core component of a holistic condition management solution.
Quasi-static trend data, which changes slowly over time, is very easy to visualize. More complex is the visualization of “fast” data, such as vibrations or pv-diagrams, which are recorded multiple times per crankshaft revolution and each cylinder compression chamber.
On one hand the amount of data that has to be visualized in real time is a challenge. On the other hand the presentation proves to be a challenge to ensure clarity and user acceptance. In this context, waterfall diagrams have become a standard, whereby the time axis is typically plotted in perspective as the third dimension. An alternative yet practical illustration is shown in Figure 4.9.
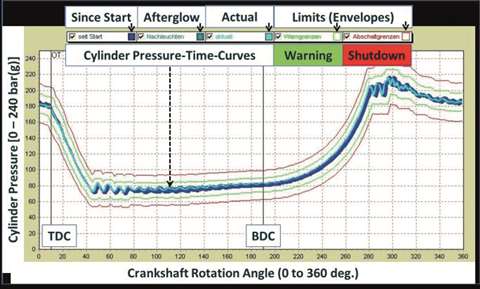 Figure 4.9. Trend diagram using color-scaling as a temporal indicator
The graph in Figure 4.9 represents the compression cycle of a cylinder over one crankshaft revolution (0 to 360 degrees).
While the light blue line represents the current course, the dark blue lines are past curves. The temporal indication in this two-dimensional chart can be taken from the color or its brightness. The time frame for the graph can be set as required. If necessary, the information over many months can be depicted at one glance.
Not only the envelope in which the curves appear but also every spike incident, none occurred in the above figure, from the corridor becomes visible. One quick look at the screen and a very good overview of the state of compression in the cylinder is obtained. The course of the upper and lower alarm and shutdown limits is also integrated here (green and red lines).
Practical implementation
The implementation of an equipment condition analysis software in everyday practice takes time and can only be done gradually due to the complexity of the analysis.
The development of the solution focuses on the main causes of unplanned downtimes. In addition, further components might be included, which have particularly high-cost implications in case of machine failure.
By focusing on the elements shown in Figure 5.1, about 80% of all sources of damage are accounted for.
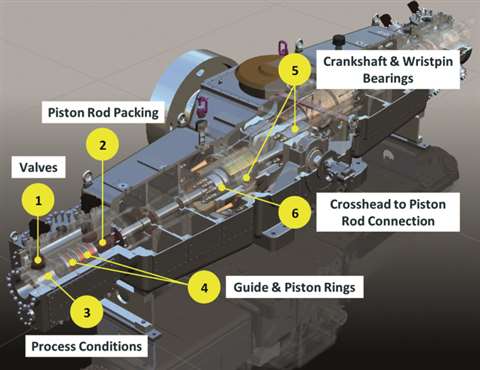 Figure 5.1. Major condition management focus points
For each of these components, a check pattern in the form of a flow chart is defined in cooperation with OEM engineers, which then gets coded into software.
The following Figure 5.2 illustrates the (very simplified) piston rod packing check.
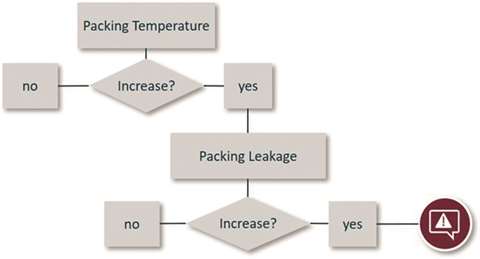 Figure 5.2. Piston rod packing check flow chart
Based on historical data, long-term statistical values can be determined for the monitored parameters, which are taken as benchmarks for automatic system notifications. These inform the maintenance staff about anomalies and potential sources of error during operation.
Following the system notifications, a personal verification is conducted, if necessary, with the utilization of further analysis systems and personal inspection of the machine at site.
If an error is detected, the plant operator receives a thorough consultation with a recommendation for actions on maintenance to be scheduled, a review of available spare parts and a suggested timing of the service. The customer then initiates the recommended maintenance activities. The service execution is documented accordingly and added to the machine history.
The overall process of practical implementation is summarized in Figure 5.3. It becomes apparent from this overall condition management process that the procedure is not easy to establish.
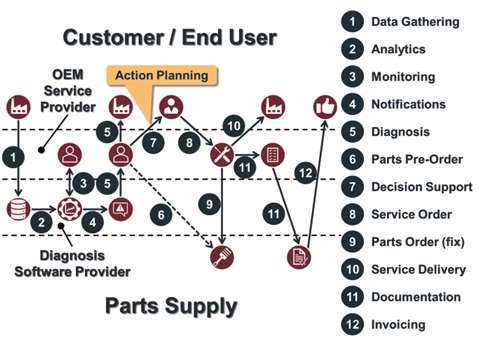 Figure 5.3. Overall condition management process
Digitalization of Murphy’s Law
Nearly every offset or failure becomes detectable, either through data, bad sound or a visual indicator. Backward identification is often more difficult because various failures can result in the same effect.
For example, if several issues send out comparable bad data, it requires more information about offsets to differentiate between the five options. In case of significant normal process variations, data might fluctuate without being critical at all. The question then results in the task of how to differentiate between “good” and “evil”?
Since the software is supposed to conduct the analysis with trend assessment, all the options with their boundary conditions have to be recognized and coded, including many unforeseen potential occurrences that one can imagine. This requires a lot of engineering and operation expertise combined with wide equipment knowledge.
Everyone with rotating equipment experience will agree that Murphy is always looking over the shoulder.
Conclusion
For successful condition management with its digitalization of “Murphy’s Law” – and to keep the same “in check” – it is essential to accurately define the relevant machine in the software language, and to define all potential wear and worst case failure scenarios with their thermodynamic and mechanical consequences.
If that is successfully digitalized, the software will be in a position to generate periodic reports on the machine conditions with recommendations for service activities in due time.
Everything beyond that, in terms of maintenance management and spare parts logistics, is a question of professional organization.
The forthcoming years will show how much will be achieved, all under the impression of the total cost of ownership reduction and with minimal site personnel.
Editor’s Note: This paper was presented in September 2019 at the International Rotating Equipment Conference in Wiesbaden, Germany
Harry Lankenau was head of technical consultanting for 17 years with NEAC Compressor Service in Germany where he was responsible for technical support, vibration surveys, diagnostics and troubleshooting.
He began his career as a mechanical engineer with Neuman & Esser Group, joining the German company in 1985 before moving to NEAC Compressor Service in 2002.
MAGAZINE
NEWSLETTER


CONNECT WITH THE TEAM